Predictive Modeling at the Speed of an Idea
Summary

If you build predictive models, you know the rhythm: have an idea, wire it in, kick off a run, wait. This iteration cycle quickly runs into hours and days when restricted by the training time of traditional models.
The problem is what this slow loop does to your choices. When testing an idea takes twenty minutes, you only run the ideas with high upfront certainty. You triage. The non-obvious features, the unconventional "I wonder if this even matters" ones, quietly never get tried, because you can afford a handful of experiments a day and you spend them on safe bets. And the awkward truth about this kind of work is that the good ideas often look like long shots right up until you run them.
We recently ran a real test of this on a basket of regional bank stocks and the whole process of trying ideas got a lot faster.
The problem, concretely
Our data universe is KRE, the SPDR (Standard & Poor's Depositary Receipts) S&P Regional Banking ETF, an exchange-traded fund that bundles together about 148 US regional banks. For every Friday since 2022, we try to predict each bank's stock return over the next 21 days, with one twist. We don't want the part of the return that comes from the whole sector moving up or down. We want the part that's specific to the bank.
That twist matters. If we just predicted raw returns, the model would mostly learn whether regional banks as a group were having a good month, which is really a bet on the sector, and a famously hard one. So we subtract it out: take each bank's return, remove the slice explained by the index moving (scaled by how sensitive that bank usually is to the index), and what's left is the bank-specific part. Quants call it the residual return. In quant terms, that is idiosyncratic alpha: the return specific to the bank, stripped of sector beta exposure.
Suppose Truist gains about 4% over a month while the sector as a whole is flat. Almost all of that 4% is Truist's own story, because the sector didn't carry it anywhere. That's the signal we're trying to predict.
Why it was fast
We tested this the honest way, with a walk-forward backtest: at each Friday the model only sees data from before that Friday, so it can never peek at the future it's being asked to predict. That's 220 separate Fridays, each its own little prediction problem.
In a normal pipeline, every one of those 220 Fridays means fitting and tuning a model from scratch. With a gradient-boosted model that's a few minutes each. The arithmetic gets painful fast.
We used Seldon instead, our tabular foundation model. The useful thing about Seldon is that you don't train it. You hand it a pile of worked examples (here are the features, here's what the residual return turned out to be) along with the rows you want predicted and it answers in one shot. No fitting and no tuning, so every Friday is a single inference call.
What is a Tabular foundation model? A model pretrained on billions of tabular datasets to understand the patterns in rows and columns, so it predicts directly on new data without a training or tuning step, the same way a large language model answers questions on topics it was never specifically trained on.
What is tabular data? Tabular data is structured information organised in rows and columns, the records living in your ERP, CRM, and data warehouse. It is the primary language of business operations, and it drives the prediction tasks that generate measurable business impact.
The whole walk-forward, all 220 weeks, runs in about 2 minutes.
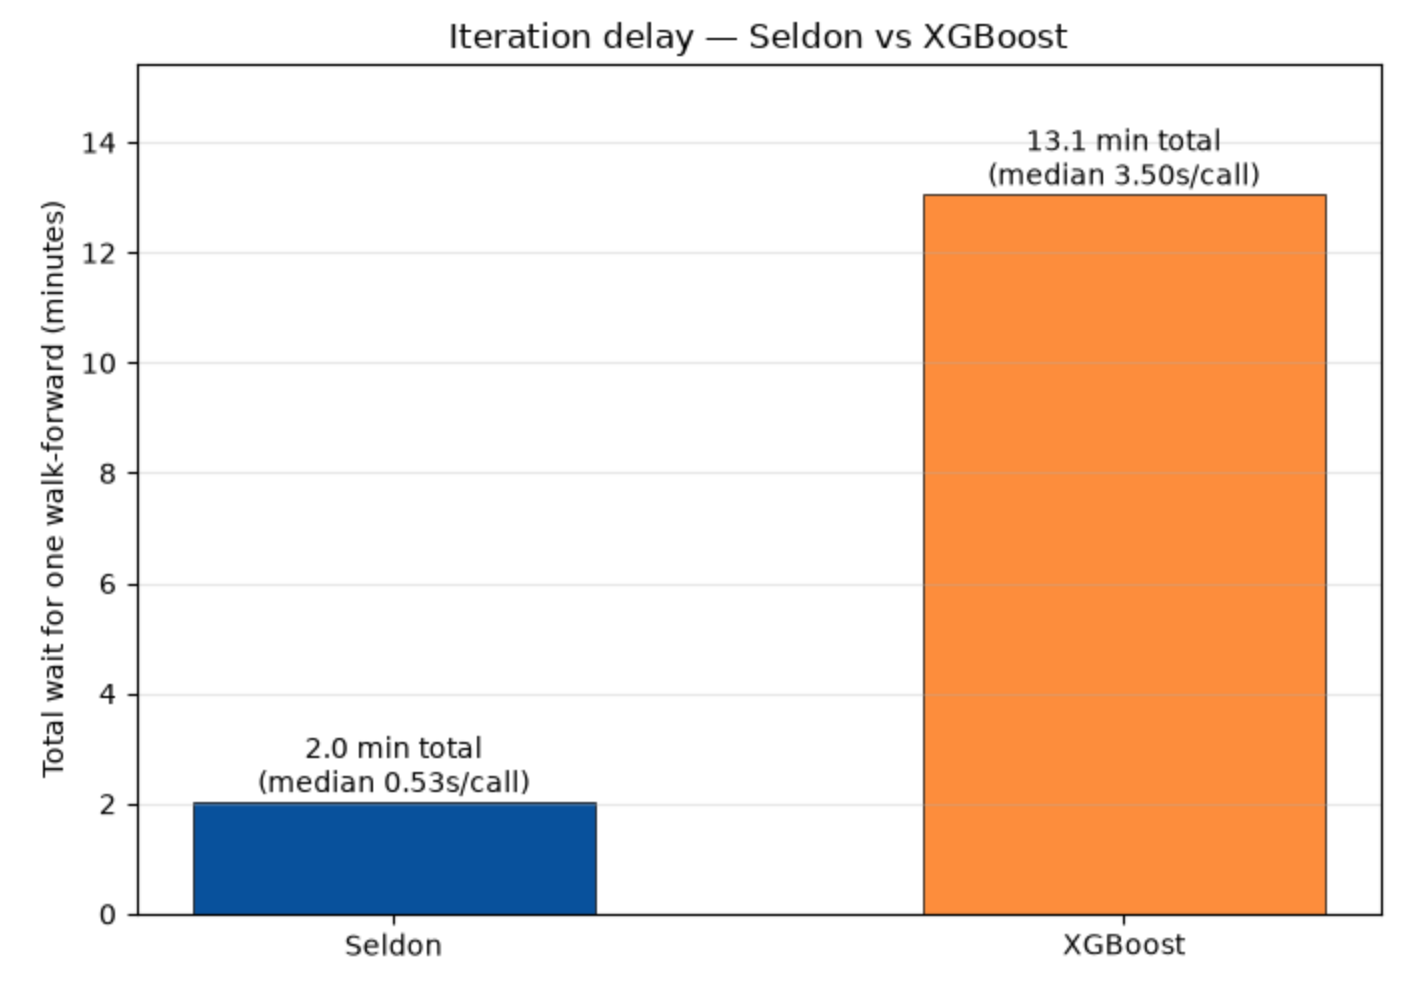
That number changes how you behave. When an experiment requires a coffee break, you ration them. When it takes a minute, you stop rationing and just try things, including the long shots you would never have spent twenty minutes on.
What that bought us
Here's the concrete payoff. Early on we used ordinary price features: momentum, recent reversal, volatility, how sensitive the bank is to the sector, size. The standard kit. They worked, sort of.
Then we asked an obvious question. If we're trying to predict the bank-specific part of returns, why are we feeding the model whole-sector returns as inputs? So we built a matching set of features shaped like the target: the same bank-specific return, measured backwards over the past 1, 3, 6 and 12 months.
That one change roughly doubled the strength of the signal. (For the quants: mean information coefficient went from about +0.023 to +0.043, and the long/short Sharpe from roughly 1.3 to 2.0.) We learned that in the time it takes to read this paragraph, because testing it was one more 2 minutes loop.
The other half: the LLM in the loop
Fast backtests remove one bottleneck. Writing the features in the first place is the other.
Most of this work, both the thinking-up and the coding, went through an LLM. We'd describe the target and the data, talk through what might carry signal, and the candidate features came back as working Python we could run straight away. So the loop became: think of a feature, have it written, test it across four years of data, all in minutes. Each step that used to eat an hour now eats a few.
Put the two together and you get something genuinely new. The model takes the training time out of testing an idea. The LLM takes the coding time out of having one. What's left is the only part that was ever the actual job: deciding what to try. Of course, there is a skill to help with this, and an MCP server on the way.
Does it actually work, though
Rank the 148 banks each Friday by the model's prediction, and the ones it favours beat the ones it shuns by roughly half a percent over the following month. Run that every week for four years and it holds up: the signal stays positive in essentially every six-month window we tested.
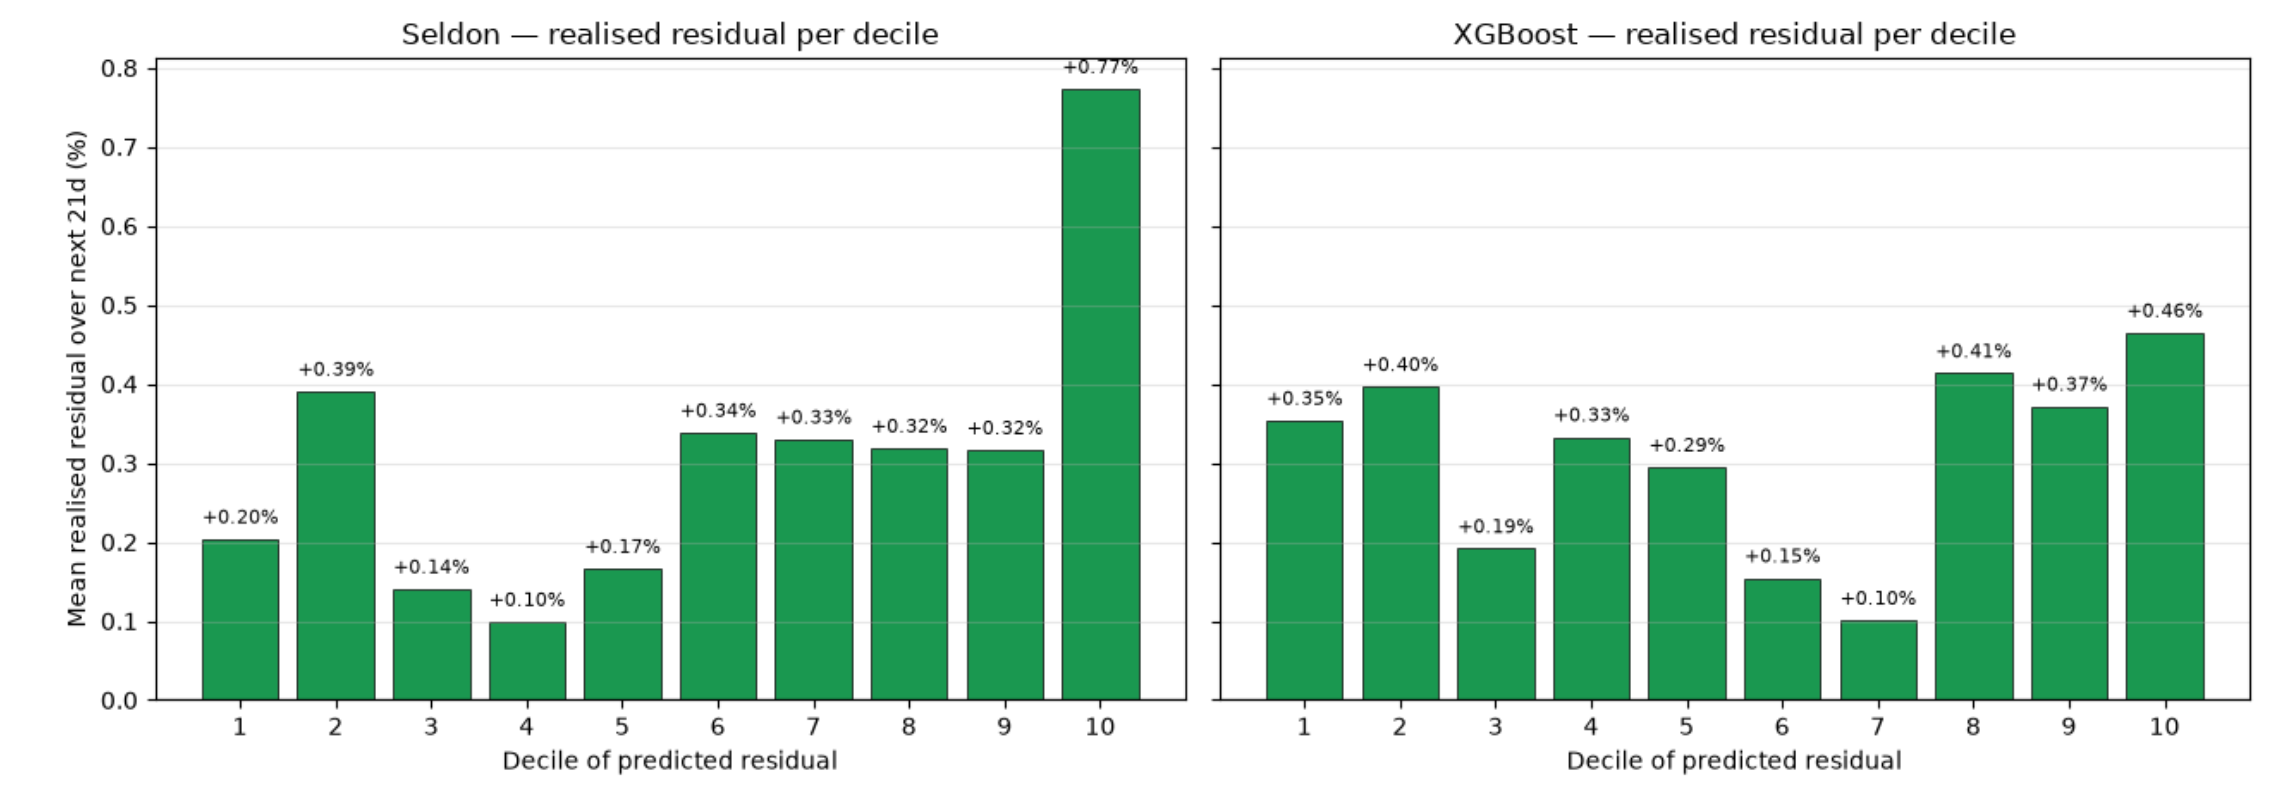
Now the caveats, because they earn their place. The test is flattering by construction: we use today's KRE members, so the banks that failed and dropped out (First Republic, Signature) never appear in the data. And the edge softens on the most recent stretch, though the model still separates the better banks from the worse ones well enough for the strategy to work.
It also beat a hard-tuned gradient-boosted baseline, the kind of model a quant would actually reach for. The advantage is coming from the model itself, well beyond the speed of running it.
The work here represents what is possible in minutes, rather than a complete trading strategy - finding that signal early might be the difference between wasting days or weeks on something that goes nowhere, versus only investing in ideas that have genuine potential.
The actual takeaway
The actual takeaway has little to do with regional banks. Two of the slow steps in predictive modeling, training the model and writing the features, were largely removed from the critical path. What's left is the part that was always the core job: having a good idea about what predicts what.
Which raises the uncomfortable follow-up. If you could test a hundred ideas a day instead of five, would you suddenly find you've run out of ideas? That's a much better problem to have, and it's the one we're in now.
This is a narrow quant example, but the underlying pattern is far broader. For many organisations, the challenge isn’t a shortage of AI use cases rather a shortage of evidence. Validating each idea takes enough engineering effort that only a handful ever get tested. When experimentation becomes cheap enough, that constraint shifts. Teams can afford to explore more of the backlog, discard weak ideas quickly, and move the successful ones into production. The impact is a higher probability that meaningful models are discovered and shipped.
Curious what a tabular foundation model could do with your data and your long-shot ideas? Try our API free.