

Summary
"The individual human being is unpredictable, but the reactions of human mobs, Seldon found, could be treated statistically. The larger the mob, the greater the accuracy that could be achieved. And the size of the human masses that Seldon worked with was no less than the population of the Galaxy which in his time was numbered in the quintillions."
Isaac Asimov, Second Foundation (1953)
Abstract
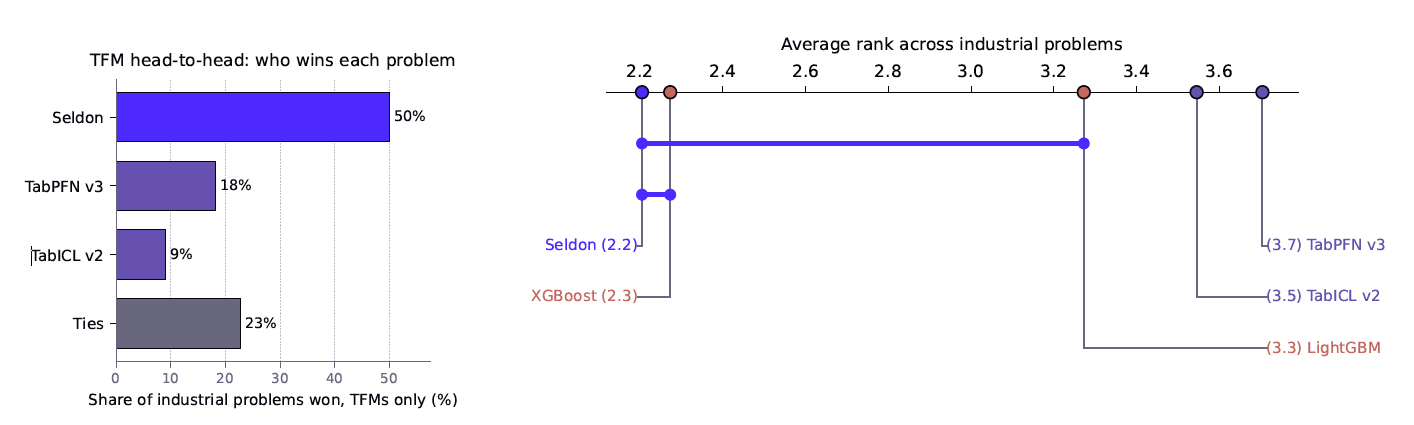
Tabular data determine most enterprise decisions: credit approvals, fraud screens, demand forecasts, clinical risk scores. For a decade, gradient-boosted decision trees have held this domain almost uncontested, and large language models have not changed that. A new paradigm is now reshaping the landscape: Tabular Foundation Models (TFMs), neural predictors pre-trained once on synthetic priors and deployed at inference time as in-context predictors. In this report we introduce Seldon, Neuralk's tabular foundation model reaching state of the art performances. We first formalize what TFMs approximate, and survey the 2022–2026 landscape. We then present results on TabBench, our open evaluation suite of 189 classification problems spanning retail, healthcare, finance, energy, and other industries. On that benchmark the top tier (Seldon, TabPFN v3 and TabICL v2) is statistically indistinguishable and sits clearly ahead of every tuned tree ensemble and every other open TFM. We then turn to private industrial data spanning five sectors (retail, behavioural, equity, transportation, and energy), 22 problems in total. The picture is different from TabBench: the strict separation between TFMs and tree ensembles disappears, tuned XGBoost and LightGBM stay competitive on every sector, and yet Seldon takes the best mean rank on the pool, narrowly ahead of XGBoost. Within the three top-tier TFMs the gap is sharper: Seldon wins outright on 50% of the industrial pool against 18% for TabPFN v3 and 9% for TabICL v2. This is the result that motivates Seldon as an industrially focused TFM. Finally we describe the public Seldon API, which removes the GPU and scaling friction that currently makes TFMs hard to adopt.
1. Tabular Machine Learning: Why It Still Matters and Why It Is Still Hard
The decisions that move the economy are highly based on tables. For more than a decade, gradient-boosted decision trees have been the operational default for predicting on those tables, and large language models have not changed that. The recent shift comes from a different direction: neural predictors that are pre-trained once and reused in-context, without per-task training.
1.1. Tabular Data is Everywhere
Transaction logs, electronic health records, ERP entries, sensor histories, credit bureau pulls: every operationally consequential prediction in finance, healthcare, retail, energy, and industry is ultimately a tabular prediction. Gartner and IDC estimate that 80–90% of new enterprise data volume is unstructured (Gartner, 2019), but the inverse framing is the relevant one for prediction: the structured 10–20% is the substrate on which models actually grade decisions.
The economic surface is large. Credit and payments fraud screens process every card transaction at sub-millisecond latency; the U.S. Treasury attributes $4B in FY2024 fraud recoveries to machine-learning-based detection (U.S. Department of the Treasury, 2024). Tabular risk models inform sepsis triage and ICU prioritisation (Precedence Research, 2025a). Demand and inventory models underpin large-scale retail operations (Walmart Global Tech, 2023). McKinsey reports 18–25% reductions in maintenance cost and 30–50% reductions in unplanned downtime from deployed predictive-maintenance pipelines (McKinsey & Company, 2021). Analyst estimates put the predictive-analytics market at $17–22B in 2025, projected to $113–285B by the mid-2030s across major forecasts (Precedence Research, 2025b).
Since 2015, the dominant family on this substrate has been gradient-boosted decision trees (GBDTs): XGBoost (Chen and Guestrin, 2016), LightGBM (Ke et al., 2017), and CatBoost (Prokhorenkova et al., 2018) have been the operational default in production. Nevertheless, the tabular learning ecosystem has remained more diverse than benchmark leaderboards alone would suggest. Generalized linear models (GLMs) (McCulloch, 2000) continue to be widely used in domains where interpretability, calibration, transparency, and regulatory compliance are critical requirements. Neural networks, although rarely the default choice for standalone tabular prediction, remained important in applications involving multimodal data fusion, multi-task learning, representation learning, and end-to-end differentiable systems.
This landscape began to evolve in the mid-2020s. Recent neural architectures for tabular data, including RealMLP (Holzmüller et al., 2024) and TabM (Gorishniy et al., 2025), have achieved performance comparable to, and sometimes surpassing, that of state-of-the-art GBDTs on standard benchmarks. Yet GBDTs remain the dominant production paradigm, benefiting from mature tooling, operational simplicity, and proven deployment practices.
1.2. Structural Challenges in Tabular Machine Learning
Tabular data are fundamentally different from pixels and tokens. Each table mixes (i) continuous features at very different scales, (ii) high-cardinality categoricals (merchant ID, ICD-10 code), (iii) ordered ordinals, (iv) informative missingness, and (v) per-row temporal context. There is no natural locality, no translation invariance, no sequence order.
The empirical record is unambiguous. Shwartz-Ziv and Armon (2022) show that in a controlled head-to-head, XGBoost beats TabNet, NODE, and DNF-Net on 9 of 11 datasets with substantially less tuning, and the only competitive deep model is an ensemble that includes XGBoost itself. Grinsztajn et al. (2022) extend this to 45 datasets and tens of thousands of runs, and isolate three causes: multi-layer perceptrons (MLPs) are biased toward smooth functions while tabular targets are piecewise axis-aligned, MLPs are less robust to uninformative features, and rotation-invariance hurts when columns have semantic identity.
Production constraints compound the difficulty. Covariate and concept drift move both \( P(X) \) and \( P(Y \mid X) \) with macro conditions and adversarial adaptation. Many tables are small-data (a new merchant has ten transactions). Labels arrive late and noisy (chargebacks settle 30–90 days later). Positive rates of fraction-of-a-percent are typical in fraud and adverse-event detection. Governance constraints (model cards, fair-lending audits, SR 11-7 model risk management) and sub-50 ms latency budgets close the box.
1.3. Generative AI did not solve this
When large language models (LLMs) began to generalise, a natural temptation was to repurpose them for tabular prediction. The empirical record so far is that this approach is strictly dominated by GBDTs outside the cold-start, very-few-shot corner.
Direct LLM-on-tabular benchmarks underperform GBDTs. TabLLM (Hegselmann et al., 2023) serialises rows to natural language and prompts T0/T-Few; it is competitive only at ≤ 8 shots, after which XGBoost surpasses it. LIFT (Dinh et al., 2022) fine-tunes GPT-3 on serialised rows and degrades sharply with dimensionality. TabuLa-8B (Gardner et al., 2024), fine-tuned from Llama-3-8B on 2.1B rows across 4M tables, achieves zero-shot accuracy more than 15 percentage points above random and beats XGBoost in the 1-32 shot regime, but loses to a properly tuned GBDT once a few hundred in-domain rows are available, which is the typical enterprise case. The survey of Fang et al. (2024) catalogues these results and concludes that LLMs are competitive only in the cold-start regime.
Numeric reasoning is still a weakness. For most of the LLM-on-tabular wave, Byte-Pair Encoding (BPE) tokenisation was the canonical reason numbers were hard: a value like 1234.56 got shattered into substring tokens whose embeddings carried no arithmetic structure, forcing the model to relearn digit position, magnitude, and monotonicity from text. Recent work has narrowed that lexical gap, with number-aware tokenisers, right-to-left digit grouping, and dedicated numeric embeddings becoming standard in 2025-vintage LLM training (OpenAI, 2024), so this is no longer the hard wall it was in 2024. The residual weakness is representational rather than lexical: even with cleaner tokenisation, LLMs continue to trail purpose-built symbolic and neural-tabular predictors on tasks that hinge on exact arithmetic, calibrated probabilities, or smooth dependence on continuous features.
Cost and latency are off by orders of magnitude. LLM inference is dominated by per-token cost and GPU latency; current frontier-model pricing is at the level of dollars per million input tokens (Appenzeller et al., 2024). This puts hosted-LLM scoring two to three orders of magnitude above commodity-CPU GBDT inference on cost, and one to two orders of magnitude above on latency. Payment-network and ad-serving budgets simply preclude hosted-LLM scoring on the hot path.
Wrong objective, wrong outputs. Generative pre-training optimises the marginal log-likelihood of token sequences, not the posterior predictive \( P(y \mid x) \) over a structured label set. The gradient that shaped the LLM's weights came from next-token prediction over arbitrary text, not from rewarding calibration, monotonicity, or any of the structured regularities tabular learning relies on. The consequences are practical: hallucinated class labels not in the schema (the output space is unconstrained token sequences, only patched at inference by constrained decoding); weaker calibration than GBDTs with isotonic scaling (LLM probabilities live in a vocabulary softmax, not a label simplex); no native abstain or out-of-distribution signal (a text-fluency score is not an epistemic measure); and a textual-output parser in front of any cost-sensitive decision, which adds its own failure modes on top of the predictor.
The right tool for tabular prediction is not a general-purpose generative model. It is a model whose pre-training task, output head, and inductive bias are aligned with the posterior predictive on heterogeneous tables. Tabular Foundation Models are the first architecture family that fits that description, and the next section formalises what they are and how they have evolved.
2. Tabular Foundation Models: The Prior-Fitted Networks Formalism
Foundation models have transformed several modalities. Pre-trained language models reshaped natural language processing, vision-language models reshaped image tasks, and similar paradigms are now reaching tabular data. Several lines of work explore what a foundation model for tables should look like: CARTE (Kim et al., 2024) attacks column-name semantics through graph attention over heterogeneous tables; TabuLa-8B (Gardner et al., 2024) treats tabular rows as serialized text and fine-tunes an LLM on them; NEXUS (Garnelo and Czarnecki, 2026) proposes a non-transformer architecture with explicit world knowledge as a latent variable. However, the family that has driven the current performance frontier on academic tabular benchmarks is the construction of the Prior-Fitted Network (PFN) (Müller et al., 2022), and that is the family we focus on for the rest of this report.
2.1. PFN Formulation
Given a query point \( x_* \) and a context \( D = \{(x_i, y_i)\}_{i=1}^n \) drawn from some data-generating process, the Bayes-optimal prediction is the posterior predictive \( p(y_* \mid x_*, D) \). Classical machine learning recovers this object for one \( D \) at a time: a hypothesis class is chosen, its parameters are fit from scratch on \( D \), and the fit is used as a point approximation. GBDTs, MLPs, and table-by-table transformers all live in this regime, and hyperparameter tuning, ensembling, and feature engineering are all attempts to compensate for the fact that no information from other tables is being used.
The TFM viewpoint reverses the order of operations. Instead of fitting one model per table, the inference is amortized: a single network \( f_\theta \) is pre-trained once to imitate the posterior predictive directly across an entire distribution of synthetic tables. The training objective can be formulated as,
\[
\theta^* = \arg\min_{\theta} \; \mathbb{E}_{D \sim p(D)} \; \mathbb{E}_{(x_*, y_*) \sim D} \left[ -\log f_\theta(y_* \mid x_*, D) \right] \tag{1}
\]
where \( p(D) \) is a programmatic generator of synthetic tables. At convergence the forward pass of \( f_{\theta^*} \) is the posterior predictive under \( p(D) \) (Müller et al., 2022): prediction on a new task collapses to a single in-context inference call, with no gradient updates required. This new paradigm behind the formalism of Prior-Fitted Network forms a new hypothesis class upon which the 2022–2026 wave of tabular foundation models heavily relies.
The art of designing a TFM boils down to three choices: the prior, the architecture, and the context.
The prior \( p(D) \). The prior is the generative distribution from which the synthetic training tables are drawn. At convergence, Equation 1 says that \( f_{\theta^*} \) literally is the Bayes posterior predictive over this prior, so the prior fixes the function class the model can represent at test time. Two paradigms split the field: real-based priors that augment existing tabular corpora, and synthetic priors that build tables programmatically. The synthetic paradigm currently dominates, and its canonical form is a structural causal model (SCM): a random directed acyclic graph (DAG) whose nodes are the features and the target, with a random functional mechanism assigned to each edge. Random inputs propagated through the DAG produce one synthetic table. In that setting we consider that one prior sample is actually one such table.
The design of SCM-based priors has evolved from simple, dense architectures toward increasingly complex and realistic causal graphs. Early TFMs, such as TabPFN v1 (Hollmann et al., 2023) and TabICL v1 (Qu et al., 2025), utilized MLP-structured SCMs. These are effectively dense DAGs where each variable is represented by a neuron in a fully connected MLP, using random activations (identity, tanh, ELU, GP-smooth) and a mix of MLP and tree-shaped mechanisms to define dependencies. Subsequent SOTA models since 2025 (Grinsztajn et al., 2026; Zhang et al., 2025a,b) have refined this into a more general Graph-based SCM approach. Instead of a fixed MLP structure, these models instantiate sparser, random DAGs (typically dozens of nodes with small latent dimensions) and apply varied transformations at each node. This evolution allows for better modeling of complex feature dependencies, with quality filters used to reject malformed datasets. Recent innovations build upon this flexible graph template: Mitra integrates tree-shaped priors into the SCM edges (Zhang et al., 2025b), LimiX introduces a joint distribution over missingness masks (Zhang et al., 2025a), and SAP-RPT-1 (ConTextTab) grounds these synthetic structures in semantically rich, real-world tables (Spinaci et al., 2025).
The architecture \( f_\theta \). A table has two informational axes: rows (allegedly independent samples) and columns (features). The architectural question for a TFM is how to extract the information on both axes at acceptable compute cost. TabPFN v1 used a standard transformer encoder that treats each row as one token and attends across rows (Hollmann et al., 2023): simple, but it compresses every row's columns into a single vector before any feature interaction is learned. TabPFN v2 made every cell its own token and applied alternating row and column attention on the resulting \( n \times d \) cell grid (Hollmann et al., 2025), capturing both axes at a per-layer cost of \( O(n^2 d + n d^2) \). The current generation (TabICL, TabPFN v3, Seldon) factorises this into three stages (Grinsztajn et al., 2026; Qu et al., 2026): a column transformer that learns a semantic latent representation for each column and uses it to refine the token of every cell in that column; a row transformer that compresses the columns of each row into a single latent embedding by attending within the row; and an in-context-learning block that attends across the resulting row embeddings to produce the prediction. The factorisation cuts inference cost to roughly \( O(n^2 + n d^2) \), which is enough to make million-row contexts feasible.
The context. A PFN passes a set of in-context labelled examples to predict the test examples. In a small academic dataset the full training set fits and there is no choice to make; in production, context windows are bounded, training corpora are not, and not every training row is equally informative for a given query. Context becomes a design lever rather than a fixed input: subsample to fit memory, retrieve nearest neighbours to lift accuracy (the route taken by TabDPT (Ma et al., 2025)), or compose a context that encodes soft inductive biases. This is a new degree of freedom for tabular modelling, with no real equivalent in the fit-one-model-per-table regime, and a loose analogue to Retrieval Augmented Generation (RAG) (Lewis et al., 2020) for LLMs. It remains largely under-explored, and represents a research direction with substantial potential.
2.2. The 2022–2026 TFM landscape
A condensed view of the field is given in Table 1; the rest of this section summarises the most influential entries.
TabPFN (Hollmann et al., 2022; Nature 2025). The seminal architecture behind the TFM idea, TabPFN v1 (Hollmann et al., 2023), is a 12-layer transformer encoder with ∼26 M parameters, trained on ∼10 M synthetic datasets from a prior that mixes SCMs with Bayesian neural networks (BNNs); it handles classification only, on ≤1,000 rows and ≤100 features. V2 (Hollmann et al., 2025) adds alternating row-and-column attention, supports regression and density estimation, scales to ∼10k rows and ∼500 features, and is trained on ∼130 M synthetic datasets. In the span of 2.8s, TabPFN v2 beats on a 29 small classification benchmarks an ensemble of tuned baselines that required hours of tuning per dataset. TabPFN-2.5 (Grinsztajn et al., 2025) extends to ∼50k rows / 2,000 features. TabPFN v3 (Grinsztajn et al., 2026) is the larger step: ∼53 M parameters, a three-stage column-then-row-then-ICL architecture, a many-class decoder, and a KV cache for amortised inference. It is benchmarked along a cell-budget frontier (rows × features): \( 1M \times 200 \), \( 100k \times 2k \), and \( 1K \times 20k \). As of early June 2026, it leads the TabArena (Erickson et al., 2025) leaderboard.
TabICL (Qu et al., ICML 2025). A three-stage architecture: first, a column transformer is applied to each column to learn a meaningful semantic latent representation that is used to inform each cell latent representation. Then, a row transformer is used to build a compressed representation of columns. Finally a final transformer performs in-context prediction (Qu et al., 2025) in the same fashion as TabPFN v1. Trained with curriculum learning that scales rows from 1k to 60k across ∼82 M synthetic datasets. On TALENT it matches TabPFN v2 while running up to \( 10\times \) faster, and pulls ahead of both TabPFN v2 and CatBoost on the larger end of the suite (datasets above 10k rows). TabICL v2 (Qu et al., 2026) extends to million-row contexts.
TabDPT (Layer 6 AI, 2024). 78 M parameters, 16 transformer layers, 600k training steps. Two design choices set TabDPT apart. First, the prior mixes real-world tabular data with synthetic data during pre-training, which yields LLM-style scaling laws (Ma et al., 2025). Second, inference itself uses retrieval: at test time TabDPT does not consume the whole training set as context, it pulls the nearest neighbors of the query from the available rows and uses them as the in-context demonstration. This retrieval head is what makes the model competitive at scale and is the canonical example of context-as-a-lever from §2. At the publish time, best overall on CTR23 (regression) and OpenML-CC18, comparable to TabPFN v2 on CTR23, stronger on CC18.
LimiX (Stable-AI, 2025). Two sizes (LimiX-2M and LimiX-16M). A 12-block transformer with axis-wise attention; the larger model uses an asymmetric two-feature-per-one-sample attention pattern per block. A single recipe addresses classification, regression, missing-value imputation, feature/sample selection, and causal inference by treating the table as a joint distribution over variables and the missingness mask (Zhang et al., 2025a). Sits in the top tier of the public TabArena leaderboard (Erickson et al., 2025); remarkably, LimiX-2M approaches LimiX-16M.
SAP-RPT-1 / ConTextTab (Spinaci et al., 2025). SAP's three-model suite (small, large, oss) implements the ConTextTab architecture: alternating row-and-column attention with weight sharing, 12 layers, hidden dim 768, ∼172 M total and ∼16 M trainable parameters (Spinaci et al., 2025). Its critical novelty is semantic embedding of categoricals and free-text columns through a pre-trained text encoder, allowing label meaning to inform predictions. ConTextTab sets a new standard on the semantically rich CARTE benchmark while remaining competitive on non-semantic suites.
Mitra (Amazon, 2025). A TFM pre-trained on a mixture of synthetic priors: SCMs combined with tree-based priors (random forests, GBDT-generated targets, decision trees) (Zhang et al., 2025b). Ablations show that the tree-prior mix is what drives gains over TabPFN v2; it reportedly outperforms TabPFN v2 and TabICL on both classification and regression with better sample efficiency. Open-sourced inside AutoGluon 1.4.
NEXUS (Fundamental, 2026). A non-transformer, deterministic "Large Tabular Model" (Garnelo and Czarnecki, 2026). The stated ambition is to make world knowledge and local reality explicit components of the model rather than something the network has to recover from data, with the hope of much stronger sample efficiency on semantic categoricals shared across tasks. Specifics of the architecture, training data, and evaluation protocol remain proprietary.
TabuLa-8B (Gardner et al., NeurIPS 2024). The reference LLM-based TFM (Gardner et al., 2024): Llama-3-8B fine-tuned on the T4 corpus (2.1B rows, 4M tables) with custom packing and attention. Achieves zero-shot accuracy more than 15 pp above random and 5–15 pp above XGBoost or TabPFN in the 1–32-shot regime, then degrades relative to tuned GBDTs as in-domain data grows.
2.3. Discussion
Two observations frame the rest of this report. The first is that TFMs have, in three years, gone from a curiosity to a state-of-the-art family on academic small-to-medium tabular benchmarks. The second is that the architectures, priors, and training regimes published so far are calibrated to a notion of "tabular data" that does not always match what runs in production. They assume isolated, complete, well-curated tables; production data are joined, partial, evolving, semantic-heavy, and governance-constrained. Independent work has documented this gap in the temporal-shift setting (Cai and Ye, 2025; Gardner et al., 2023; Klein and Hoffart, 2025). Section 4 measures it directly across five sectors of private industrial data.
3. TabBench: A Classification Benchmark for Tabular Foundation Models
On TabBench's 189-dataset benchmark, a small set of recent Tabular Foundation Models opens a clear and reproducible gap over tuned tree ensembles. Three models, namely Seldon, TabPFN v3 and TabICL v2, sit at the top of the leaderboard with results that are statistically indistinguishable from one another.
3.1. Protocol
TabBench is Neuralk's open evaluation suite for tabular classification, hosted on the public Hugging Face Space 1 and backed by the open-source repository 2. The snapshot used in this report covers 189 OpenML classification datasets sourced from OpenML CC-18, the AutoML benchmark, TabZilla (McElfresh et al., 2023), and a curated extension of operationally interesting tasks across retail, healthcare, finance, energy, and several other industries. The benchmark spans binary and multi-class classification, from a few hundred to several hundred thousand rows, up to ∼2,000 features after preprocessing, with mixed numerical, categorical, ordinal, and free-text columns and realistic missingness.
Workflow. Every model goes through the same evaluation pipeline: (i) stratified shuffle split into 5 train/test folds with 20% of the rows held out at each fold; (ii) automatic column-type detection followed by categorical preprocessing, numerical preprocessing, term-frequency / inverse document-frequency (TF-IDF) vectorisation for free-text columns, and label encoding of the target; (iii) classifier fit and prediction: hyperparameters are optimized (if applicable) towards area under the receiver-operating characteristic curve (ROC-AUC). The preprocessing block is model-aware and follows each model's recommended practice: tree-based methods receive ordinal-encoded categoricals and raw numericals; MLPs receive embedded categoricals and z-score normalised numericals; TFMs are passed the columns as-is and rely on their own internal preprocessing. This keeps the comparison fair so that model differences, not feature-engineering differences, drive the leaderboard.
Hyperparameter Optimisation. Tunable baselines (XGBoost, CatBoost, LightGBM, RealMLP, TabM, ModernNCA) receive a budget of 100 Optuna trials per dataset, optimised on a nested 5-fold shuffle split of the training set. For ensembling, the top-performing trials for each dataset are bagged together. TFMs (TabPFN-2.5, TabPFN v3, TabICL v1, TabICL v2, TabDPT, Mitra, LimiX, and Seldon) are evaluated zero-shot: no per-task tuning, no fine-tuning. Each TFM is called through its own default recommended inference engine, including the default ensemble strategy shipped with the public release. Seldon is called through the public Neuralk API.
Reported metrics. ROC-AUC is the optimisation target; accuracy is reported as a secondary check. Per-dataset numbers are first averaged across the 5 folds; cross-dataset numbers aggregate those per-dataset means.
3.2. Results
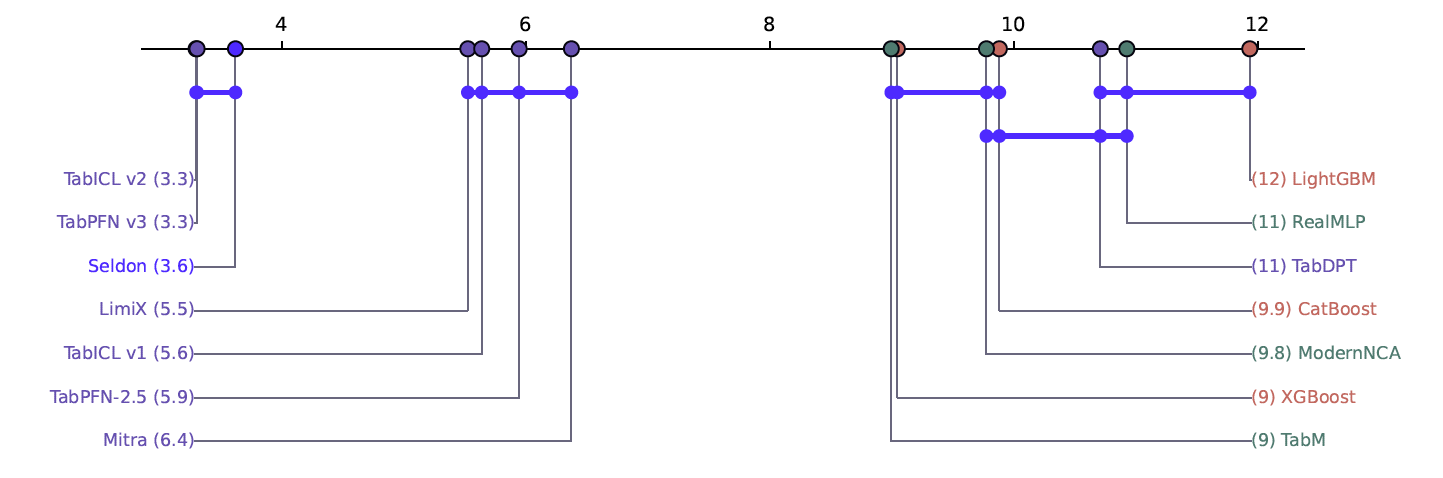
We report every metric on the same set of 189 datasets for every model. That universe is the largest one on which the most context-restrictive top-tier TFM (TabPFN v3) runs natively, which gives us a single common slate where every model can be ranked side by side. Two TFMs cannot run on every one of those 189 datasets: Mitra and LimiX hit context ceilings on 20 to 30 percent of the universe. To keep the comparison apples-to-apples we apply a single, conservative rule: any dataset where a model fails to produce a result is imputed with GBDT average performance on that dataset. This is a deliberate GBDT-fallback assumption (in production one would route to a tuned tree ensemble whenever a TFM cannot handle the input). The proportion of imputed datasets per model is reported in Table 2; a low value means the model ran natively on most of the suite, a high value means most of its score was inherited from XGBoost.
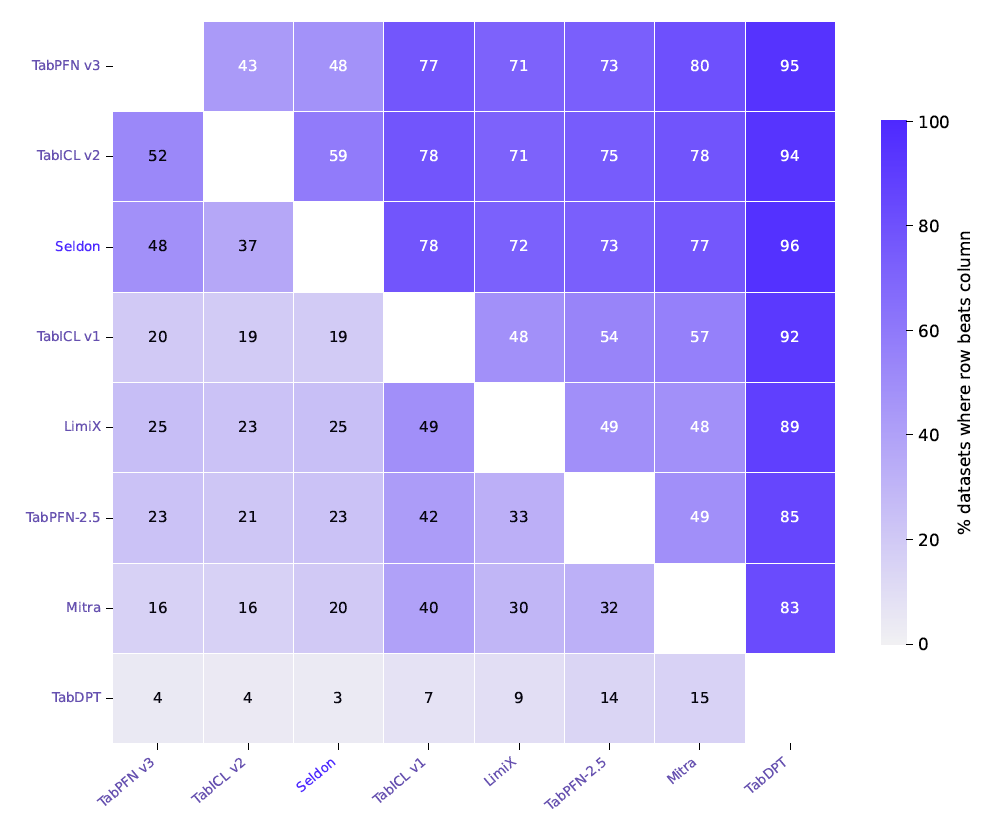
TFMs Outperform GBDTs. Seven of the eight TFMs we benchmark (TabPFN v3, Seldon, TabICL v2, TabICL v1, LimiX, Mitra, and TabPFN-2.5) occupy the top seven slots in mean AUC. The gap between the weakest of those (TabPFN-2.5 at 0.894) and the best non-TFM (ModernNCA at 0.887) is roughly 0.7 AUC points, a gap that would require a substantial increase in tuning budget for the GBDT side to close, and that the GBDTs in our sweeps did not close. The gap to the strongest tree ensemble (XGBoost at 0.884) is larger still, and LightGBM at 0.865 sits at the bottom of the boosting band. One TFM (TabDPT, 0.873) underperforms and lands inside the deep-tabular band. Combined, the TFM family wins 88.4% of the 189 head-to-head datasets, leaving 6.4% for the six non-TFM models put together, with the remainder a tie.
Native Coverage Matters. Imputation rates vary widely across the TFM family. Mitra and LimiX inherit XGBoost's score on 28.6% and 19.0% of the suite respectively because they cannot natively run those datasets, and TabPFN-2.5 imputes another 16.4%. By contrast, Seldon, TabPFN v3, and TabICL v1 impute on 0.0%; TabICL v2 imputes 2.1% and TabDPT 1.1%. The practical implication is structural: in production a TFM that cannot run on a sizeable dataset is a TFM whose effective performance is bounded by your fallback model. Mitra at 0.895 AUC looks similar to TabPFN-2.5 at 0.894, but 29% of Mitra's score is literally XGBoost's score reused.
Seldon, TabPFN v3 and TabICL v2 form a statistically indistinguishable leading group. TabPFN v3's mean AUC (0.906) is 0.2 pp above Seldon (0.904) and 0.4 pp above TabICL v2 (0.902), all inside the noise floor of a 189-dataset benchmark. On accuracy the same three lead at 0.862, 0.861, and 0.859 respectively, again within noise. The win-rate picture separates them slightly: TabPFN v3 collects the most strict wins at 27.5%, TabICL v2 follows at 22.8%, and Seldon at 14.8%. Seldon also runs natively on 100% of the suite, tied for the lowest imputation rate with XGBoost, CatBoost, LightGBM, RealMLP, TabM, TabICL v1, and TabPFN v3. The broader picture is unambiguous: three TFMs sit clearly ahead of every other model on this benchmark, and Seldon is one of them.
3.3. Analysis
For the first time in the history of supervised tabular learning, a small set of pre-trained models, deployed without any per-task training, beats hyper-tuned tree ensembles on a broad academic benchmark and does so by a margin that does not close under more tuning.
Inside that winning family the top is now tight: Seldon, TabPFN v3 and TabICL v2 are statistically tied, and the gap between this top tier and the next set of TFMs (TabPFN-2.5, LimiX, TabICL v1, Mitra) is itself reproducible across both mean rank and mean AUC. The implication for practitioners is that the choice within the top tier is no longer about peak accuracy, on which the three leaders are equivalent, but about coverage, latency, and deployment.
TabBench establishes that the TFM family has crossed the tree-ensemble frontier on academic data, and that Seldon sits in the top tier of that family alongside TabPFN v3 and TabICL v2. The next section moves from the leaderboard to private industrial data, where the gap between TFMs and tuned tree ensembles narrows and where the differences between top-tier TFMs become operationally meaningful.
4. The Industrial Benchmark
The AUC gap that TFMs open over tuned tree ensembles on academic benchmarks does not transfer cleanly to industrial data. Across a private portfolio of 22 problems spanning five sectors, tuned XGBoost and LightGBM remain competitive. Seldon still lands at the best mean rank on the pool, narrowly ahead of XGBoost, and clearly ahead of the other two top-tier TFMs: it wins on 50% of the problems against 18% for TabPFN v3 and 9% for TabICL v2.
4.1. The Industrial Challenges
Academic benchmarks are pre-cleaned. Industrial datasets are not. Moving from CC-18 or CTR23 to a typical client engagement introduces:
• Heterogeneous schemas. Hundreds of high-cardinality categoricals (SKU IDs, merchant IDs, ICD codes), free-text product descriptions, nested JSON columns flattened to features.
• Pervasive missingness, often informative. Missing values are not random: the missingness mask is itself a strong predictor.
• Label scarcity and label noise. Labels arrive late (chargebacks, returns, readmissions) and are corrupted by upstream labelling pipelines.
• Distribution shift. Train and test boundaries are temporal, not random; macro conditions, seasonality, and adversarial adaptation move \( P(X) \) and \( P(Y \mid X) \) continuously.
• Class imbalance. Positive rates of 0.1% to 3% are typical in fraud, defect, and adverse-event prediction.
• Low signal-to-noise ratio. The predictive component of a feature is often a sliver of its variance: in equity forecasting it sits below cross-sectional noise, in behavioural data it competes with confounders, and in energy diagnostics the ground truth itself is a noisy regulator-driven proxy.
The synthetic priors that power public TFMs (SCM-based, BNN-based, tree-based) capture none of these properties faithfully. Synthetic categoricals carry no semantic meaning; synthetic missingness follows the missing-completely-at-random (MCAR) or missing-at-random (MAR) patterns rather than the informative missingness of production data; synthetic class imbalance is uniform; and there is no mechanism for temporal drift, adversarial dynamics, or heavy-tailed regimes. Independent work has documented this gap quantitatively (Cai and Ye, 2025; Klein and Hoffart, 2025).
The combined effect is that a model selected on academic benchmarks is not necessarily the model best equipped to survive these conditions; robustness to them is a separate axis that the academic frontier under-tests.
4.2. Protocol
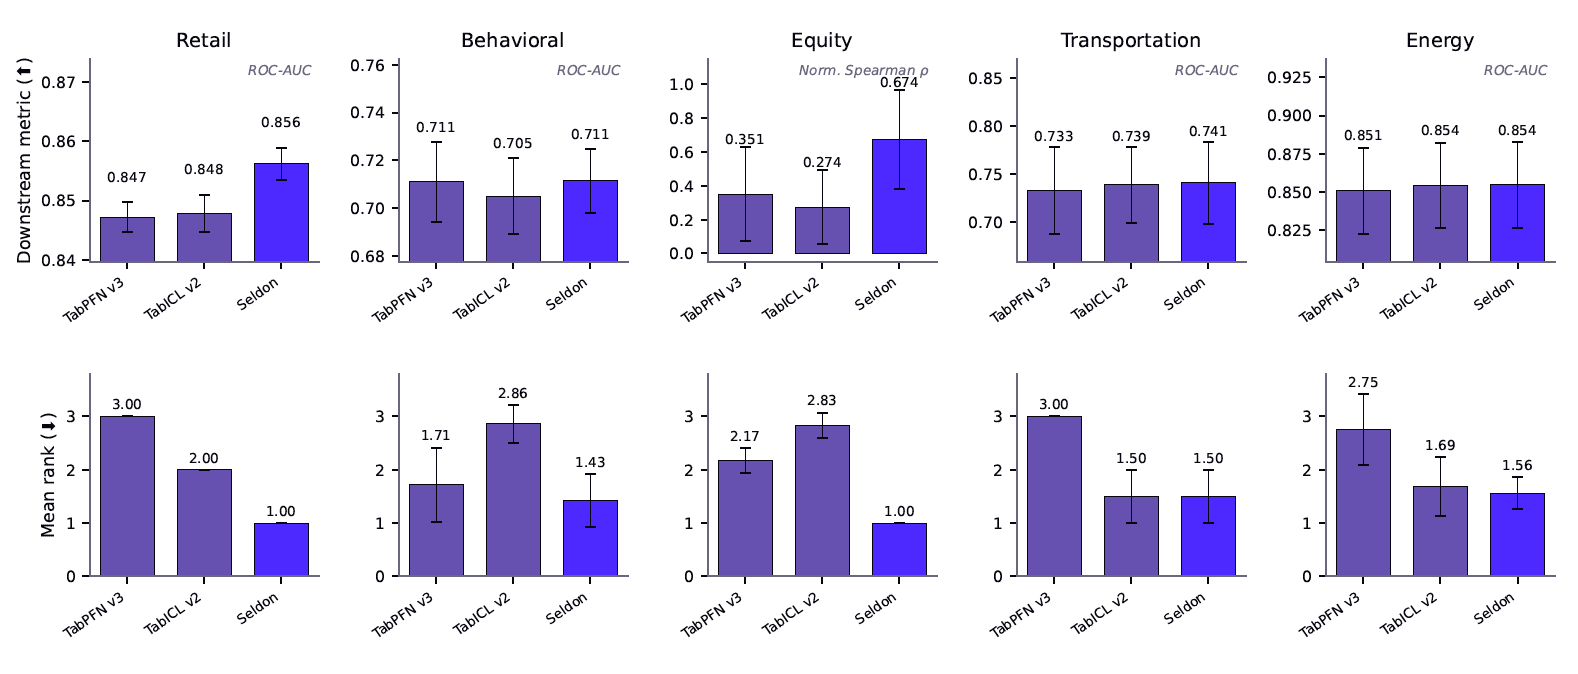
To put the academic ranking to the test we evaluate the leading model of each family on a portfolio of anonymised production problems: the two strongest tuned tree ensembles (XGBoost and LightGBM) and the three top-of-leaderboard TFMs (Seldon, TabPFN v3, and TabICL v2). The portfolio is partitioned across five sectors (retail, behavioural, equity, transportation, and energy), with several problems per sector and 22 problems in total. The pooled view covers all 22 problems, on which every one of the five models has a result. We report ROC-AUC and rank averaged across problems within each sector (Fig. 4).
The portfolio combines private datasets shared by client engagements with public datasets that share the same characteristics and operational character. We give a broad description of each sector below; client identities, dataset names, and full feature schemas are omitted for confidentiality.
Retail. A multi-million-row SKU-level pricing and product-metadata dataset from a single retailer. The task is to predict a binned product-return rate (five quintile classes) from a mix of categorical and numerical features, evaluated under time-ordered rolling windows.
Behavioural. Customer-churn prediction on operational panels concatenated at seven different base-rate setpoints, ranging from very low (one-and-a-half percent positive rate) to moderate (thirty percent). Stressing models across the imbalance regime is the point of the sector: it isolates how each model holds up as the prevalence of the positive class shrinks.
Equity. Cross-sectional equity-return prediction on multi-million-row financial panels, evaluated under standard temporal shift (test window after the training window). The reported metric is the Spearman correlation between predicted and realised forward returns. The public panel is built from Qlib's Alpha158 feature set on the CSI-300 universe; the other panels come from different financial actors on different asset types.
Transportation. Monthly regularity statistics for public rail operations, drawn from the SNCF open-data platform (ressources.data.sncf.com). The task is to predict a binned late-rate class from route, schedule, and calendar features. This is a real operational signal pulled directly from a production reporting pipeline, with the heterogeneity (multiple service types, route compositions, time windows) that comes with it.
Energy. Building energy-performance certification on hundreds of thousands of buildings, drawn from ADEME's public DPE-V2 dataset for existing residential buildings (data.ademe.fr). The task is to predict a seven-class performance label (A through G) from the building's construction year, geometry, heating system, climate zone, and other physical attributes. The data is stratified into four construction-era cohorts because the underlying physical relationships shift across eras (post-2000 buildings are dominated by insulation rules that did not exist before 1948).
4.3. Results
Seldon is the clear TFM leader on the industrial problems. Among the three top-tier TFMs, Seldon achieves the best aggregate mean rank, beats TabPFN v3 on 18 of 22 problems and TabICL v2 on 15 of 22, and leads or co-leads the TFM group on every sector with available data. The 18-of-22 and 15-of-22 head-to-head margins against the other two top-tier TFMs are far too large to be explained by noise on a 22-problem pool. For an industrial deployment among the three top-tier TFMs, the choice is not a coin flip.
Tree ensembles are competitive, but lead stays to Seldon. Seldon achieves the best mean rank on the global pool (mean rank 2.21 of 5), narrowly ahead of XGBoost at 2.27, with LightGBM at 3.27, TabICL v2 at 3.55, and TabPFN v3 at 3.71 trailing. In direct head-to-head, Seldon beats XGBoost on 12 of 22 problems and LightGBM on 14 of 22. Per sector, tuned trees lead on retail, behavioural, and equity; transportation is tied between Seldon and TabICL v2; energy goes to Seldon (mean rank 1.69), with TabICL v2 a close second.
The academic TFM advantage narrows on industrial data, and tuned tree ensembles remain competitive. Within the TFM family the gap between Seldon and the next two leaders that disappears on TabBench reopens here.
5. Serving Tabular Foundation Models: The Seldon API
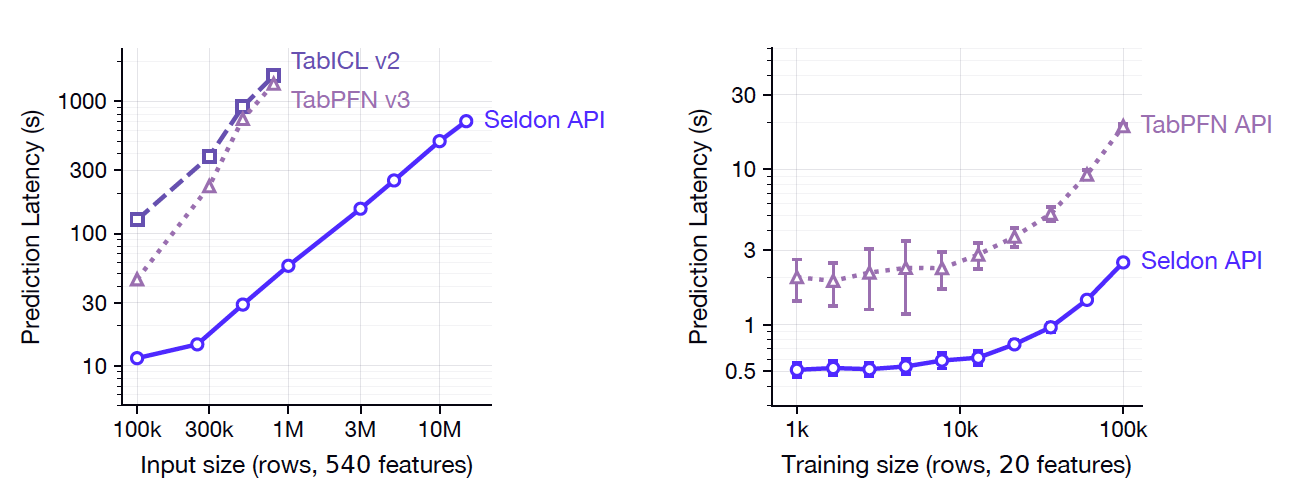
The benchmarks of Sections 3 and 4 report accuracy; deployment is a separate axis. TFM architectures are quadratic in either the row count or the cell count and require a GPU on the inference path, so applying one to a new table is a non-trivial engineering step. The Seldon API absorbs that step into a hosted, scikit-learn-compatible endpoint with a free tier. This section reports its prediction latency on row counts up to 5 M and describes its programmatic surface.
from neuralk import SeldonClassifier
model = SeldonClassifier()
model.fit(X_train, y_train)
predictions = model.predict(X_test)
5.1. Deployment of Current TFMs
TFM architectures are quadratic in either the row count or the cell count: with naive cell attention, peak activation memory grows as \( O(n^2 d + n d^2) \), which on an 80 GB H100 saturates well before the million-row regime. Published checkpoints respond by capping the supported context (TabPFN v3 lists a row-feature frontier of \( 1M \times 200 \), \( 100k \times 2k \), or \( 1k \times 20k \)), by learning compact representations of columns (as done by most state-of-the-art TFMs), or by retrieval (TabDPT). Using any of these checkpoints in a reasonable amount of time requires running PyTorch on a GPU on the inference path.
Figure 5 reports forward-pass latency of free-tier API (Seldon, TabPFN) and open-source implementation of SOTA TFMs on a single H100 80 GB GPU. The left panel covers row counts from 100K to 15 M at 540 features, with no context sampling: every call runs a full forward pass over the entire input. The Seldon API handles large context efficiently, completing a 15 M-row pass in under 12 min. The TabICL v2 and TabPFN v3 traces were obtained by loading the public PyTorch checkpoint locally and running a single forward pass on the same hardware (H100-80GB), using all default parameters from the inference pipeline (including the corresponding ensembling methods) without batching, distillation, or sampling; they are included for reference and are not a matched comparison between models. These numbers measure pure forward-pass compute and exclude network transfer of the input to the hosted backend. For a 10 M-row, 540-feature payload (roughly 20 GB), transfer is bounded by client-side bandwidth rather than by the API; for workloads where it becomes the dominant cost, the Seldon SDK supports on-premise.
The right panel compares the free tier Seldon API to the free tier of the Prior Labs API, which serves TabPFN v3 (including network transfer for both APIs). To the best of our knowledge this is the only other public TFM service in operation, so the comparison is between services. On a small-context regime (20 features, 100 test rows, 1k to 100k context rows, mean ± std over 20 repetitions per grid point). Only prediction time is measured after all payload uploads (context and queries), except for Seldon where the test upload is still taken into factor. Despite this small handicap the Seldon API is faster than the Prior Labs API on every measured grid point.
5.2. The Seldon API
Seldon is delivered as a hosted service through the `neuralk` Python package. The model is exposed as a scikit-learn estimator: it implements the `fit` / `predict` interface, dispatches between classification and regression from the target, and composes with scikit-learn pipelines, cross-validation utilities, and metric stacks. A complete integration is three lines. Authentication is by API key, passed inline (`Seldon(api_key=...)`) or read from the `NEURALK_API_KEY` environment variable. The hosted backend holds the GPU side of the inference path; for self-hosted deployments the same SDK targets an on-premise endpoint (`Seldon(host=...)`)3.
The benchmarks reported in Sections 3 and 4 are produced by calling the public Seldon API with default settings.
The Seldon API exposes Seldon predictive ability through a very easy-to-use sklearn interface that scales easily up to several millions rows and several hundred of columns. The benchmarks in this report are produced by calling this API with default parameters.
6. Conclusion
This report places Seldon, Neuralk-AI's tabular foundation model, on the public record alongside its closest peers and pulls out the three observations that frame the field today.
The first is that the field has crossed a threshold. Pre-trained in-context predictors, deployed without per-task training, now beat hyper-tuned tree ensembles on a broad academic benchmark by a margin that does not close under more tuning. Section 3 documents this for 189 OpenML classification problems: seven of the eight TFMs we benchmark sit in the top seven slots, and a tight cluster of three (Seldon, TabPFN v3, TabICL v2) is statistically indistinguishable at the top.
The second is that this academic frontier is not the industrial frontier. On 22 industrial problems across five sectors (Section 4), the strict separation between TFMs and tree ensembles disappears. Tuned XGBoost and LightGBM stay competitive on every sector. Within the TFM family, however, a gap appears between Seldon, TabPFN v3, and TabICL v2: Seldon wins outright on 50% of the industrial pool against 18% for TabPFN v3 and 9% for TabICL v2, and narrowly takes the best mean rank overall.
The third is that Seldon is usable today. The model behind the benchmark numbers in this report is the same one served through the public `neuralk` Python package, a single scikit-learn-compatible interface that removes the GPU and integration friction (Section 5). The numbers here are reproducible by any caller of the API.
The Seldon Plan. Tabular Foundation Models remain a nascent field, with many high-potential research directions yet to be explored. What makes synthetic data priors effective is still poorly understood, despite its direct bearing on generalisation. The time complexity of dominant architectures scales quadratically with the number of rows, constraining the scale of training data and, with it, the prospect of truly large-scale tabular pretraining. Native modelling of temporal data could meanwhile unlock valuable new use cases. These are but a few examples of the open frontier that lies ahead.
1 https://huggingface.co/spaces/Neuralk-AI/tabbench
2 https://github.com/Neuralk-AI/TabBench
3 https://docs.neuralk.ai/
References
• Guido Appenzeller, Matt Bornstein, and Martin Casado. LLMflation: LLM inference cost trends. Andreessen Horowitz blog, 2024.
• Hao-Run Cai and Han-Jia Ye. Understanding the limits of deep tabular methods with temporal shift. In ICML, 2025.
• Tianqi Chen and Carlos Guestrin. XGBoost: A scalable tree boosting system. In KDD, 2016.
• Tuan Dinh, Yuchen Zeng, Ruisu Zhang, Ziqian Lin, Michael Gira, Shashank Rajput, Jy yong Sohn, Dimitris Papailiopoulos, and Kangwook Lee. LIFT: Language-interfaced fine-tuning for non-language machine learning tasks. In NeurIPS, 2022.
• Nick Erickson, Lennart Purucker, Andrej Tschalzev, David Holzmüller, Prateek Mutalik Desai, David Salinas, and Frank Hutter. TabArena: A living benchmark for tabular machine learning. In NeurIPS Datasets and Benchmarks, 2025.
• Xi Fang, Weijie Xu, Fiona Anting Tan, Jiani Zhang, Ziqing Hu, Yanjun Qi, Scott Nickleach, Diego Socolinsky, Srinivasan Sengamedu, and Christos Faloutsos. Large language models on tabular data: Prediction, generation and understanding. TMLR, 2024.
• Josh Gardner, Zoran Popovic, and Ludwig Schmidt. Benchmarking distribution shift in tabular data with TableShift. In NeurIPS Datasets and Benchmarks, 2023.
• Josh Gardner, Juan C. Perdomo, and Ludwig Schmidt. Large scale transfer learning for tabular data via language modeling. In NeurIPS, 2024. Alias (12) used in Table 1.
• Marta Garnelo and Wojciech Marian Czarnecki. Developing foundation models for real-world tabular data. Fundamental Research Labs whitepaper, 2026. Alias (11) used in Table 1.
• Gartner. Estimates of unstructured-data growth in enterprise. industry report, 2019.
• Yury Gorishniy, Akim Kotelnikov, and Artem Babenko. Tabm: Advancing tabular deep learning with parameter-efficient ensembling. In ICLR, 2025.
• Léo Grinsztajn, Edouard Oyallon, and Gaël Varoquaux. Why do tree-based models still outperform deep learning on typical tabular data? In NeurIPS Datasets and Benchmarks, 2022.
• Léo Grinsztajn, Klemens Flöge, Oscar Key, Felix Birkel, Philipp Jund, Brendan Roof, Benjamin Jäger, Dominik Safaric, Simone Alessi, Adrian Hayler, Mihir Manium, Rosen Yu, Felix Jablonski, Shi Bin Hoo, Anurag Garg, Jake Robertson, Magnus Bühler, Vladyslav Moroshan, Lennart Purucker, Clara Cornu, Lilly Charlotte Wehrhahn, Alessandro Bonetto, Bernhard Schölkopf, Sauraj Gambhir, Noah Hollmann, and Frank Hutter. TabPFN-2.5: Advancing the state of the art in tabular foundation models. arXiv, 2025. Alias (3) used in Table 1.
• Léo Grinsztajn, Klemens Flöge, Oscar Key, Felix Birkel, Philipp Jund, Brendan Roof, Mihir Manium, Shi Bin Hoo, Magnus Bühler, Anurag Garg, Dominik Safaric, Jake Robertson, Benjamin Jäger, Simone Alessi, Adrian Hayler, Vladyslav Moroshan, Lennart Purucker, Philipp Singer, Alan Arazi, Julien Siems, Jan Hendrik Metzen, Georg Grab, Nick Erickson, Siyuan Guo, Eliott Kalfon, Simon Bing, David Salinas, Clara Cornu, Lilly Charlotte Wehrhahn, Diana Kriuchkova, Kursat Kaya, Lydia Sidhoum, Marie Salmon, Jerry Chen, Madelon Hulsebos, Yann LeCun, Samuel Müller, Bernhard Schölkopf, Sauraj Gambhir, Noah Hollmann, and Frank Hutter. TabPFN-3: Technical report. Prior Labs whitepaper, 2026. Alias (4) used in Table 1.
• Stefan Hegselmann, Alejandro Buendia, Hunter Lang, Monica Agrawal, Xiaoyi Jiang, and David Sontag. TabLLM: Few-shot classification of tabular data with large language models. In AISTATS, 2023.
• Noah Hollmann, Samuel Müller, Katharina Eggensperger, and Frank Hutter. TabPFN: A transformer that solves small tabular classification problems in a second. In ICLR, 2023. Alias (1) used in Table 1.
• Noah Hollmann, Samuel Müller, Lennart Purucker, Arjun Krishnakumar, Max Körfer, Shi Bin Hoo, Robin Tibor Schirrmeister, and Frank Hutter. Accurate predictions on small data with a tabular foundation model. Nature, 2025. Alias (2) used in Table 1.
• David Holzmüller, Léo Grinsztajn, and Ingo Steinwart. Better by default: Strong pre-tuned mlps and boosted trees on tabular data. NeurIPS, 2024.
• Guolin Ke, Qi Meng, Thomas Finley, Taifeng Wang, Wei Chen, Weidong Ma, Qiwei Ye, and Tie-Yan Liu. LightGBM: A highly efficient gradient boosting decision tree. In NeurIPS, 2017.
• Myung Jun Kim, Léo Grinsztajn, and Gaël Varoquaux. CARTE: Pretraining and transfer for tabular learning. In ICML, 2024.
• Tassilo Klein and Johannes Hoffart. Foundation models for tabular data within systemic contexts need grounding. arXiv, 2025.
• Patrick Lewis, Ethan Perez, Aleksandra Piktus, Fabio Petroni, Vladimir Karpukhin, Naman Goyal, Heinrich Küttler, Mike Lewis, Wen-tau Yih, Tim Rocktäschel, et al. Retrieval-augmented generation for knowledge-intensive nlp tasks. NeurIPS, 2020.
• Junwei Ma, Valentin Thomas, Rasa Hosseinzadeh, Alex Labach, Hamidreza Kamkari, Jesse C. Cresswell, Keyvan Golestan, Guangwei Yu, Anthony L. Caterini, and Maksims Volkovs. TabDPT: Scaling tabular foundation models on real data. In NeurIPS, 2025. Alias (7) used in Table 1.
• Charles E McCulloch. Generalized linear models. Journal of the American Statistical Association, 2000.
• Duncan McElfresh, Sujay Khandagale, Jonathan Valverde, Vishak Prasad C, Benjamin Feuer, Chinmay Hegde, Ganesh Ramakrishnan, Micah Goldblum, and Colin White. When do neural nets outperform boosted trees on tabular data? In NeurIPS Datasets and Benchmarks, 2023.
• McKinsey & Company. Prediction at scale: How industry can get more value out of maintenance. McKinsey & Company, 2021.
• Samuel Müller, Noah Hollmann, Sebastian Pineda Arango, Josif Grabocka, and Frank Hutter. Transformers can do Bayesian inference. In ICLR, 2022.
• OpenAI. Gpt-4o system card. OpenAI gpt-4o system card, 2024. Describes the o200k base tokenizer and improved numerical tokenization via 3-digit grouping.
• Precedence Research. Healthcare predictive analytics market. industry report, 2025a.
• Precedence Research. Predictive analytics market. industry report, 2025b.
• Liudmila Prokhorenkova, Gleb Gusev, Aleksandr Vorobev, Anna Veronika Dorogush, and Andrey Gulin. CatBoost: Unbiased boosting with categorical features. In NeurIPS, 2018.
• Jingang Qu, David Holzmüller, Gaël Varoquaux, and Marine Le Morvan. TabICL: A tabular foundation model for in-context learning on large data. In ICML, 2025. Alias (5) used in Table 1.
• Jingang Qu, David Holzmüller, Gaël Varoquaux, and Marine Le Morvan. TabICLv2: A better, faster, scalable, and open tabular foundation model. ICML, 2026. Alias (6) used in Table 1.
• Ravid Shwartz-Ziv and Amitai Armon. Tabular data: Deep learning is not all you need. Information Fusion, 2022.
• Marco Spinaci, Marek Polewczyk, Maximilian Schambach, and Sam Thelin. ConTextTab: A semantics-aware tabular in-context learner. In NeurIPS, 2025. Alias (9) used in Table 1.
• U.S. Department of the Treasury. Recovery of $4 billion in fraud through machine-learning-based detection. press release, 2024.
• Walmart Global Tech. AI-Powered inventory: Case study. Walmart Global Tech blog, 2023.
• Xingxuan Zhang, Gang Ren, Han Yu, Hao Yuan, Hui Wang, Jiansheng Li, Jiayun Wu, Lang Mo, Li Mao, Mingchao Hao, Ningbo Dai, Renzhe Xu, Shuyang Li, Tianyang Zhang, Yue He, Yuanrui Wang, Yunjia Zhang, Zijing Xu, Dongzhe Li, Fang Gao, Hao Zou, Jiandong Liu, Jiashuo Liu, Jiawei Xu, Kaijie Cheng, Kehan Li, Linjun Zhou, Qing Li, Shaohua Fan, Xiaoyu Lin, Xinyan Han, Xuanyue Li, Yan Lu, Yuan Xue, Yuanyuan Jiang, Zimu Wang, Zhenlei Wang, and Peng Cui. LimiX: Unleashing structured-data modeling capability for generalist intelligence. arXiv, 2025a. Alias (8) used in Table 1.
• Xiyuan Zhang, Danielle C. Maddix, Junming Yin, Nick Erickson, Abdul Fatir Ansari, Boran Han, Shuai Zhang, Leman Akoglu, Christos Faloutsos, Michael W. Mahoney, Cuixiong Hu, Huzefa Rangwala, George Karypis, and Bernie Wang. Mitra: Mixed synthetic priors for enhancing tabular foundation models. In NeurIPS, 2025b. Alias (10) used in Table 1.
AUTHORS
Nicolas Atienza • Alexandre Abraham • Nicolas Makaroff • Stanislas Angebault • Louis Le Dain • Salomé Gobbi • Arthur Nahmias • Clément Dureuil • Nicola Cancedda • Alexandre Pasquiou
research@neuralk-ai.com • neuralk.ai • © 2026 Neuralk-AI